As cities grow, and travel in the cities increases, we need to find new solutions to enable people's need to travel while avoiding congestion. What if not only vehicles, but also the city itself could get us faster from starting point to destination? How can the city achieve a decrease of our travel time?
City Accelerator investigates tools to reduce travel time in the city. And even though the tools were developed to reduce travel time, they could be used in a different way to optimize other elements of the city as well. The tools are generic and could be applied to any city or building. The main hypothesis of the City Accelerator is: the more adaptable the city, the lower the travel time. City Accelerator tests the impact of each tool and the impact of the level of adaptivity on travel time in the city.
The City Accelerator format
The project consists of four distinct phases:
1. Case study baseline: analysis of the current situation of the case study
2. Abstraction of the case study baseline
3. Tool application on the abstracted case study, evaluation of the case study after the tool application.
4. Lose abstraction of the case study: include liveability to the design baseline.
Phase 1. Case study baseline
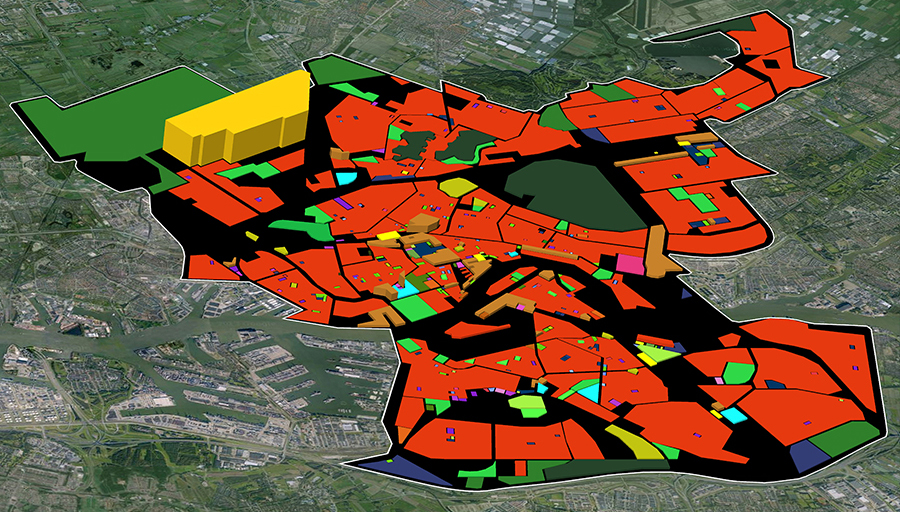
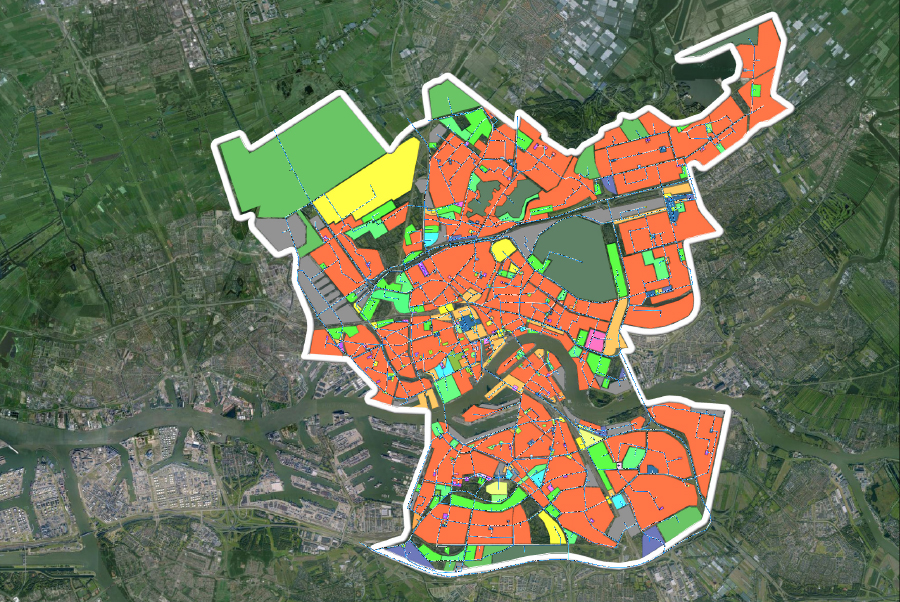
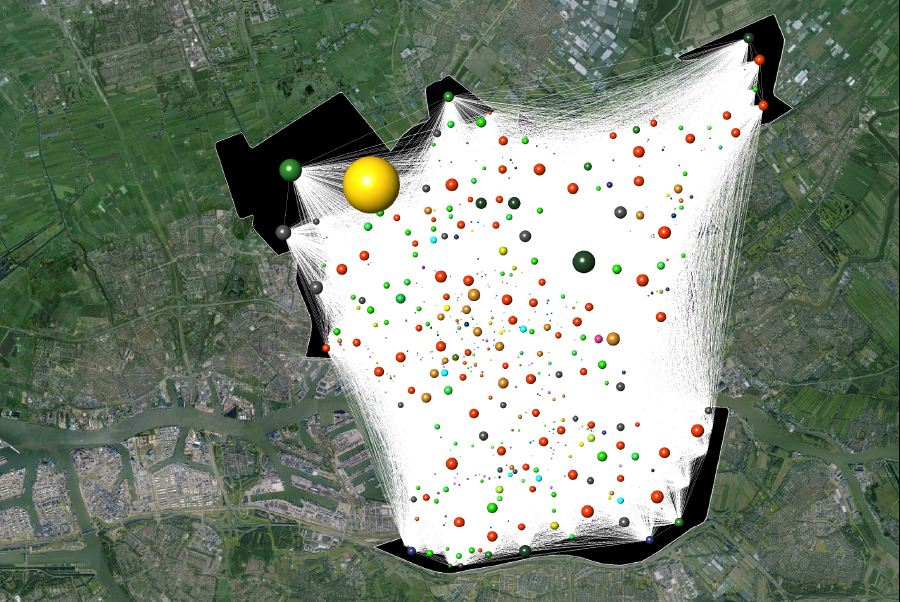
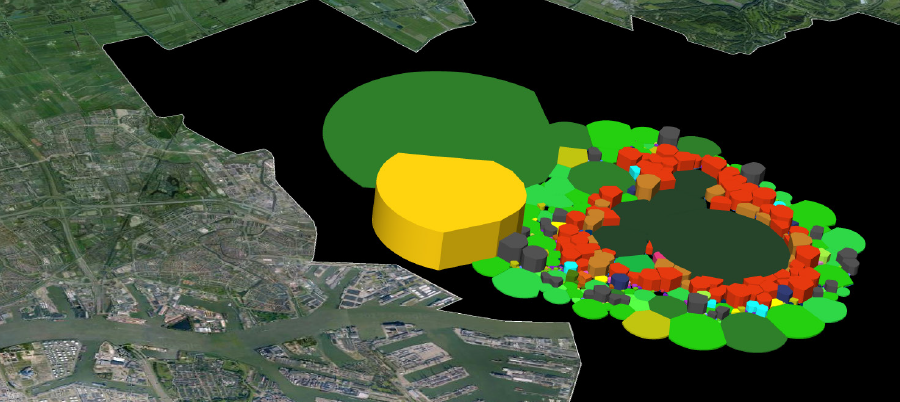
Even though the project's format and developed tools are generic and could be applied to any case study, this project chose the city of Rotterdam as a test case study.
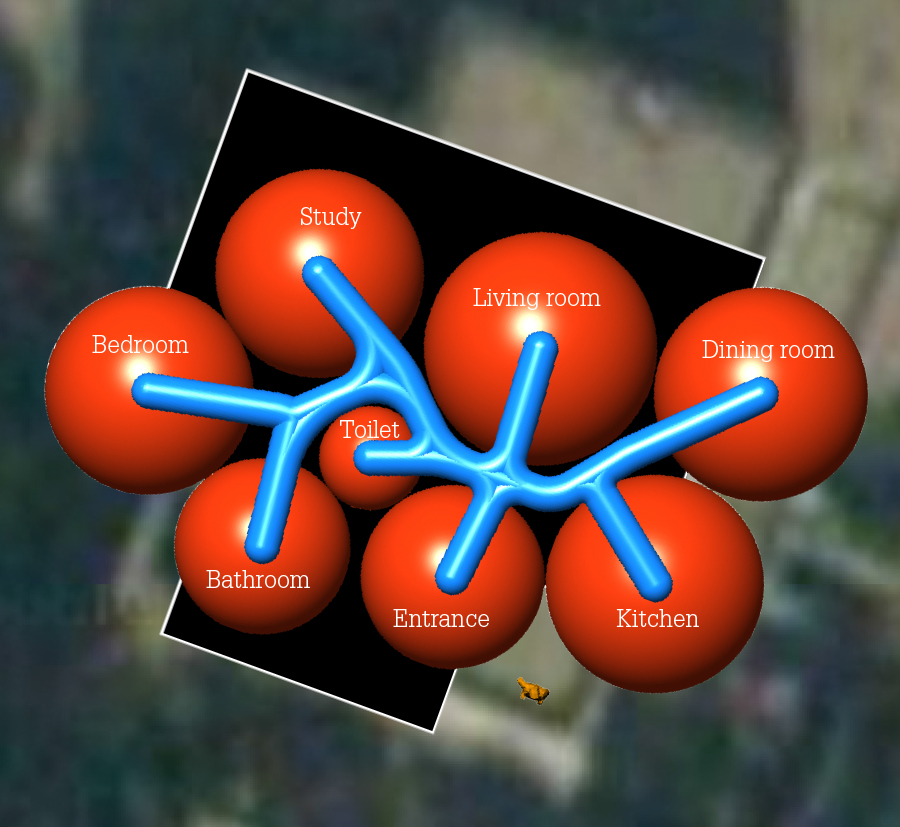
The case study border defines the part of Rotterdam this study focusses on. Within the border 45 functions occupy an amount of square meters and cubic meters. They are connected to each other by main pathways with a certain length, location and volume.
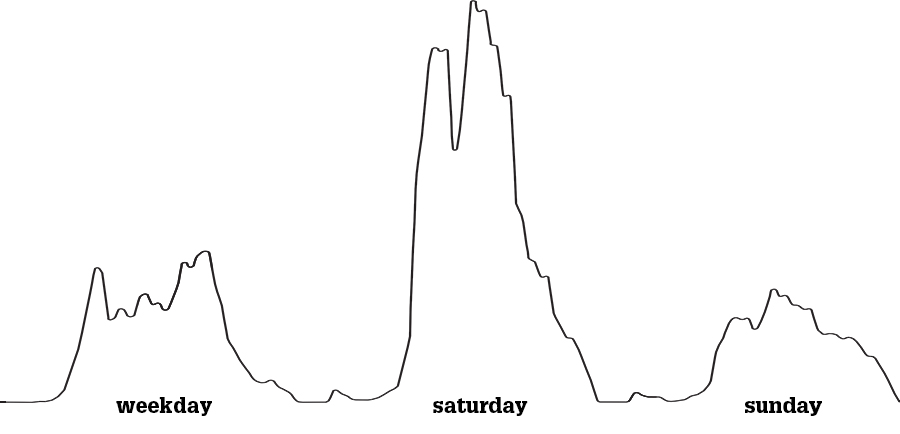
City Accelerator estimated the amount of travel to different destinations at different times during the week based on Dutch data from research institutions. With this mobility data we can estimate the total amount of travel time in the city of Rotterdam. Within this case study border, Rotterdam citizens and visitors are estimated to spend 12 hours and 28 minutes per week on travel in case all travel is done by bike.
Phase 2. Abstraction
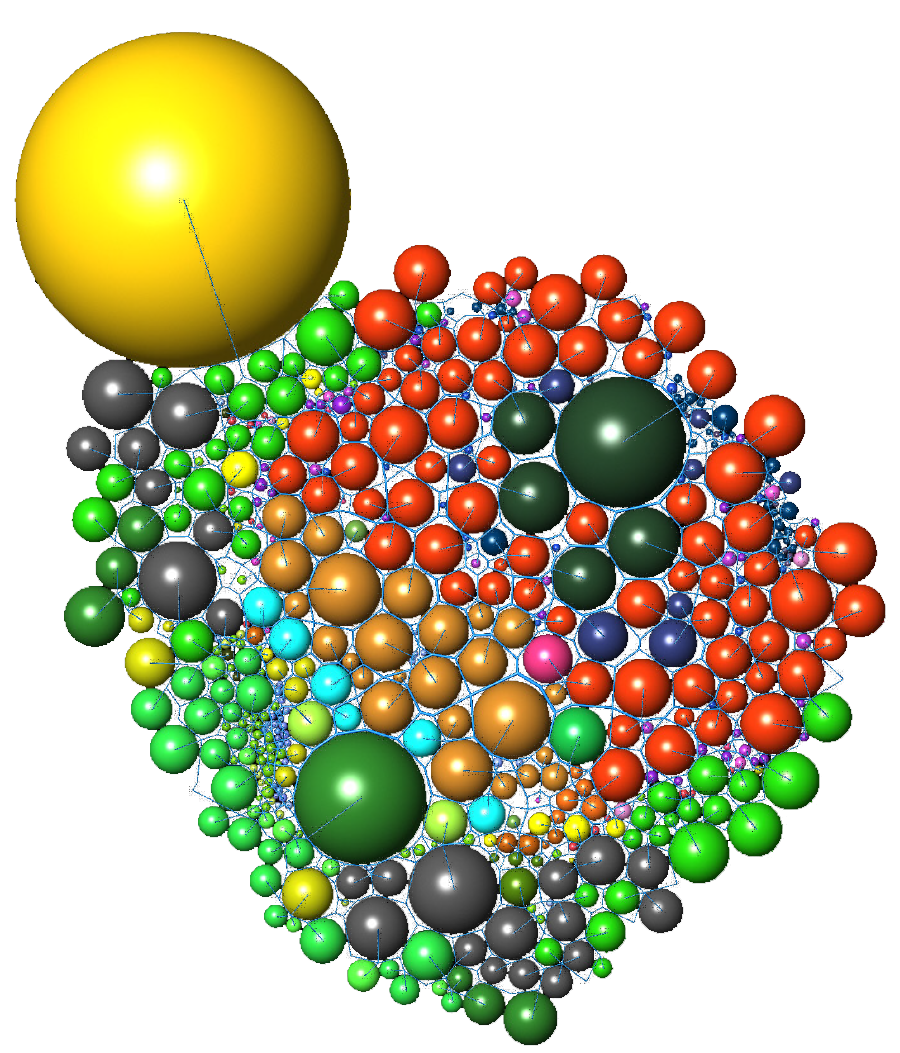
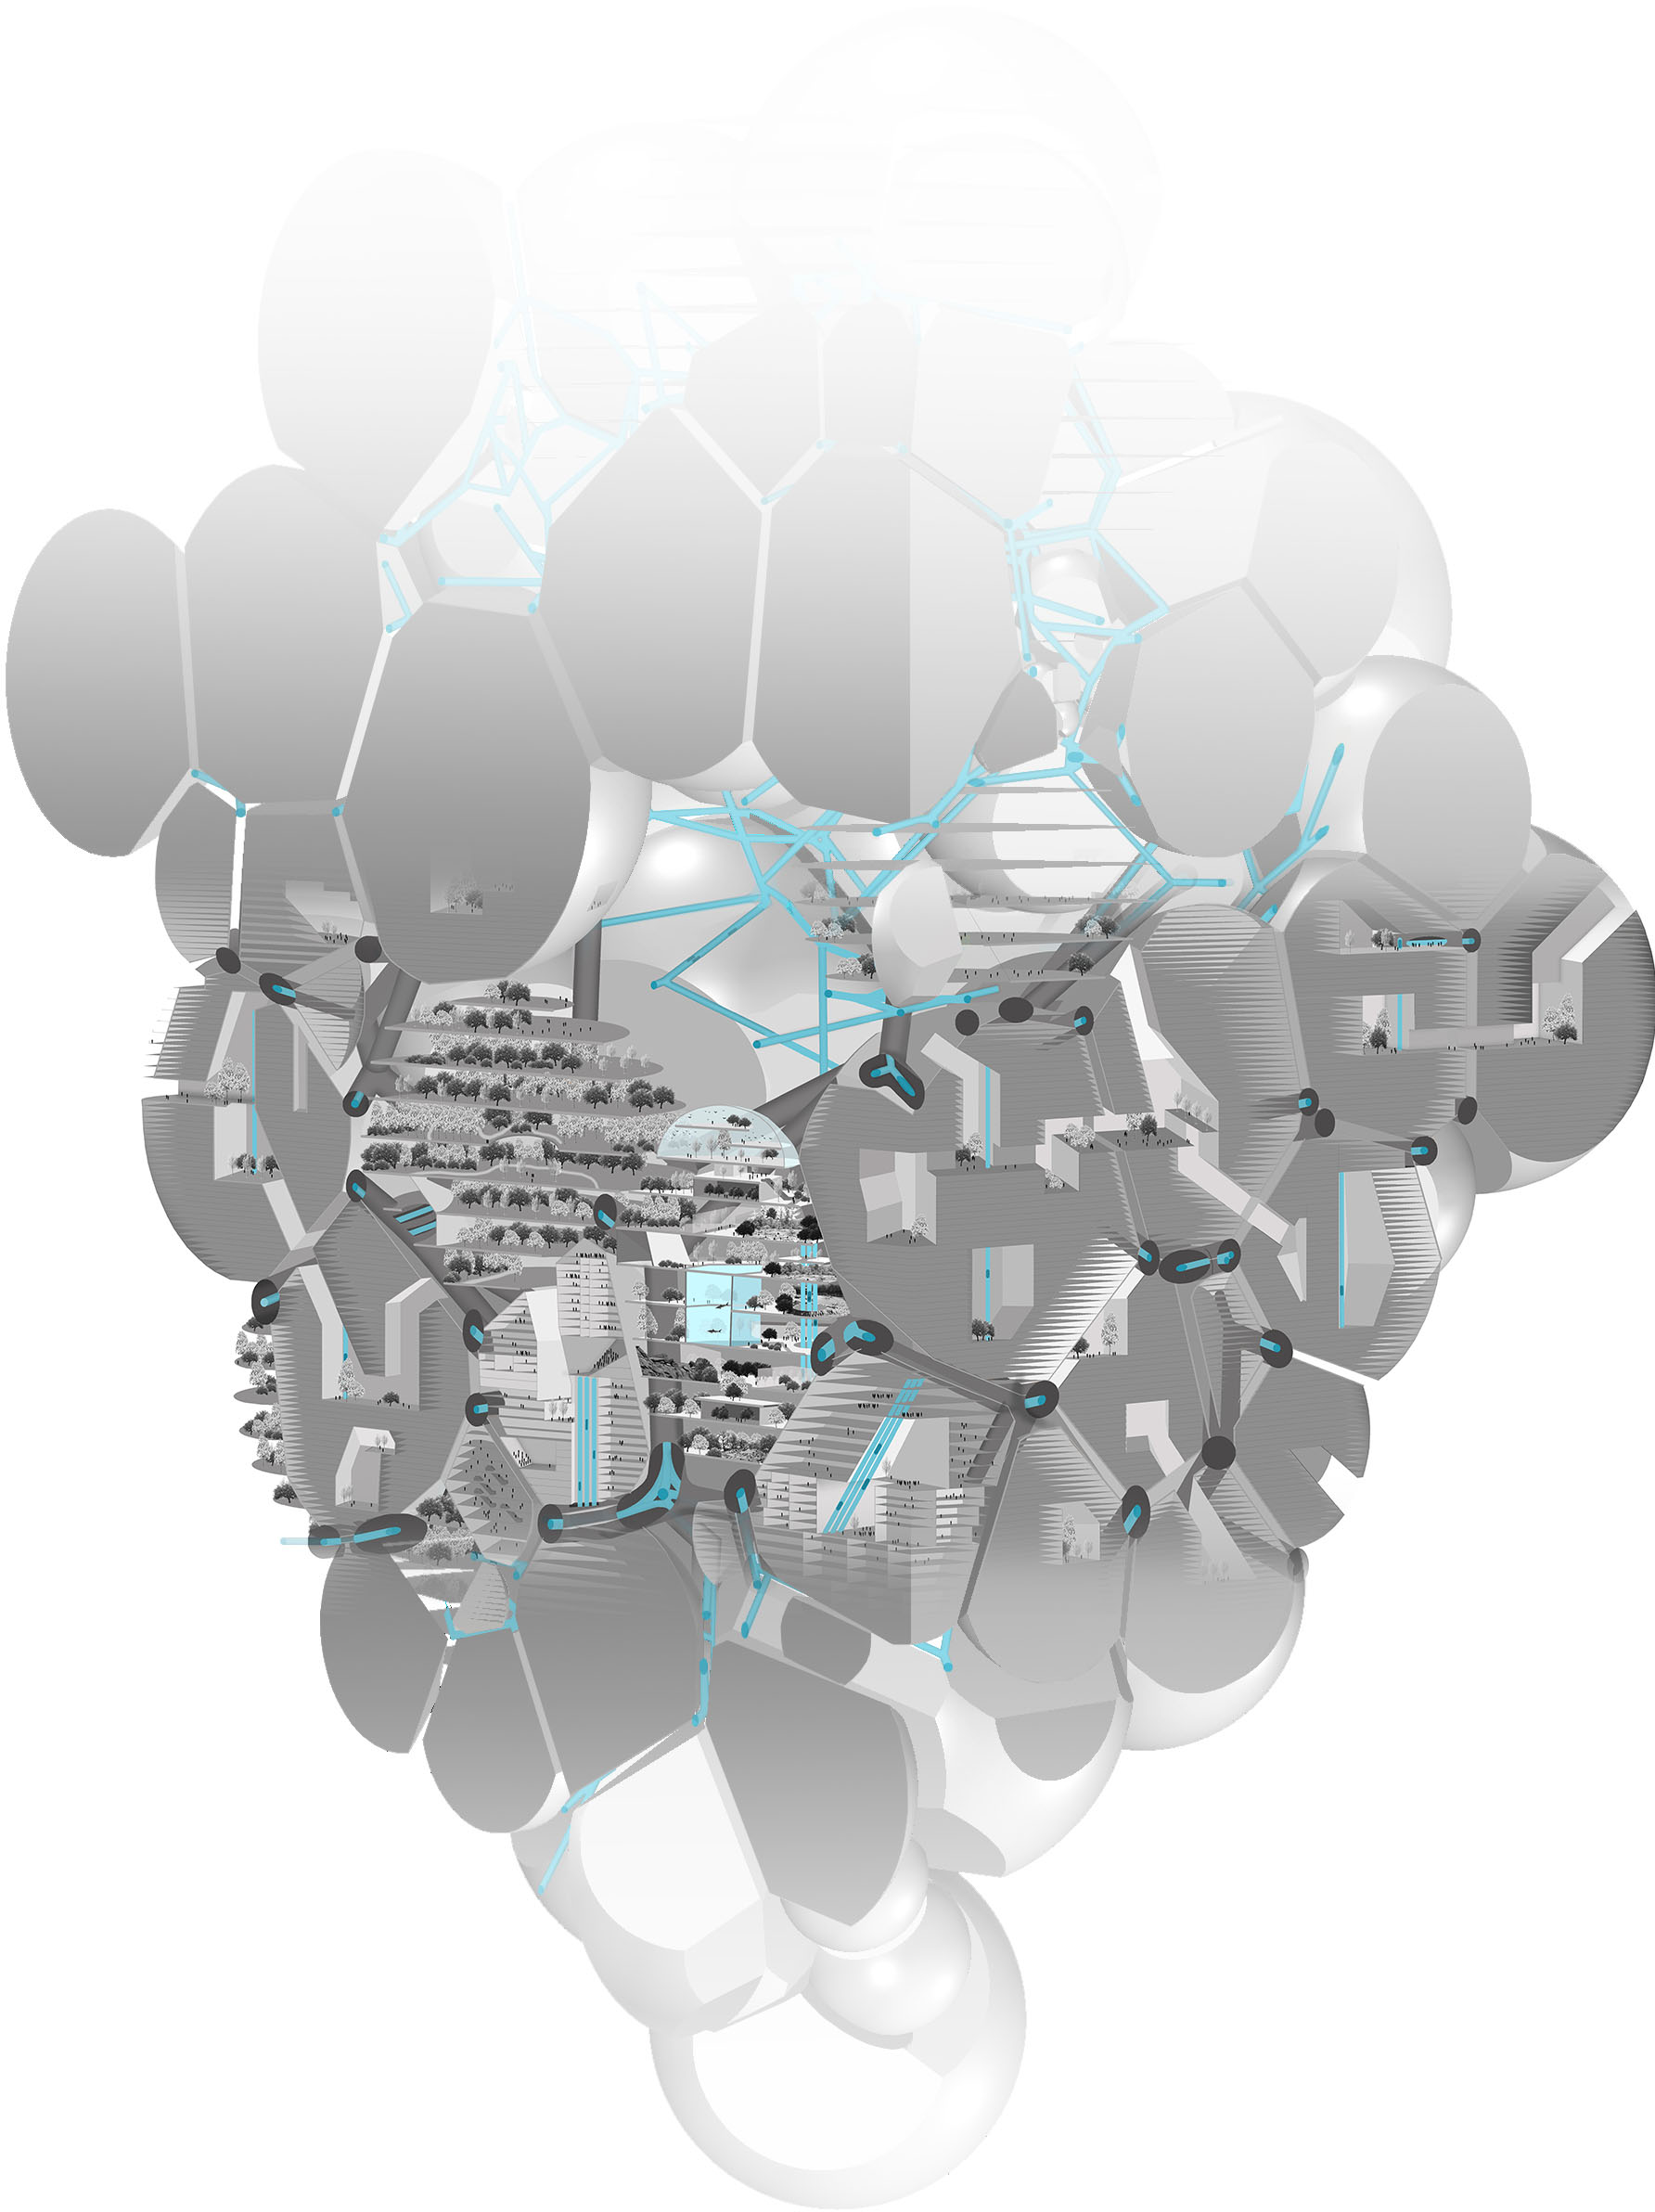
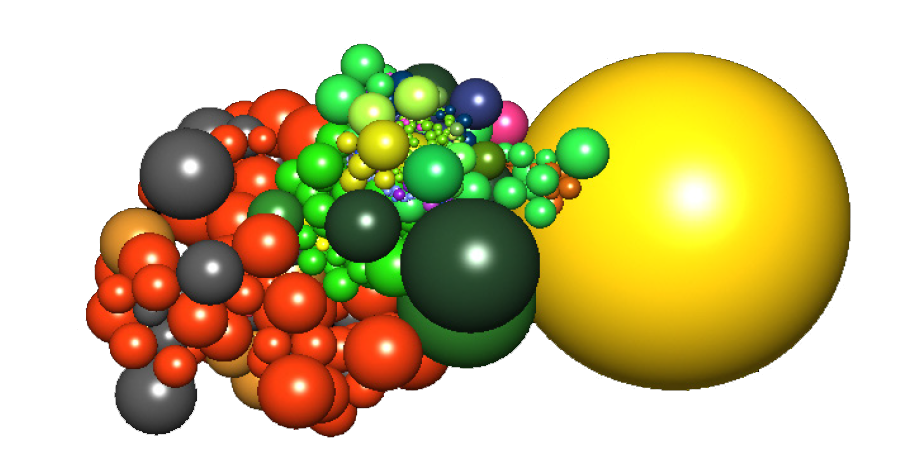
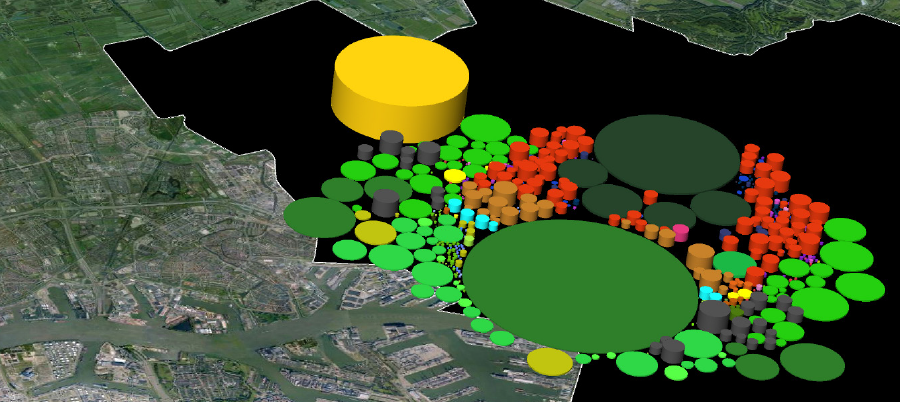
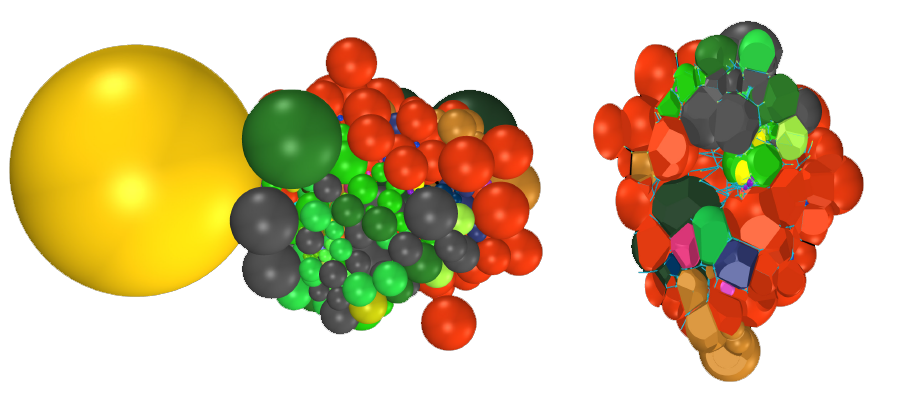
Abstract visualization of volumes and connections in the city will both help to clearly understand the sitation and gives freedom to test different tools, and compare the results of the tools. The function volumes are represented as spheres keeping the same amount of volume. Pathways are abstracted into direct lines keeping the same starting and end points.
What does travel time depend on?
When vehicle speed is constant, travel time depends on:
Pathway length: the longer the pathway, the more travel time. Pathway crossings: crossings lead to vehicles slowing down and waiting time, and thus an increase in travel time. Transit time: travel time is increased by the time to move between vehicles and the waiting time for the departure of the vehicle. Pathway inclination: reduces and increases the speed of vehicles moving up and down respectively, thus effecting travel time. Congestion: when the pathway intensity is higher than the pathway capacity, this leads to congestion and thus increased travel time.
Phase 3. Tool application
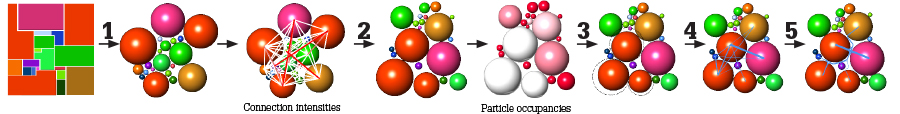
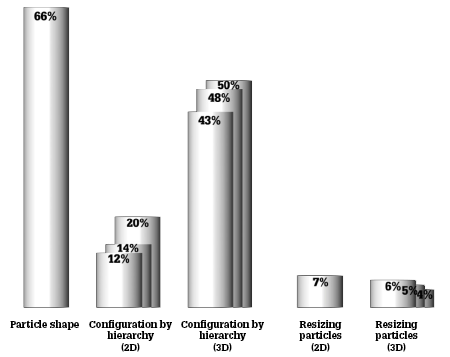
Tool 1 Reshape particles: By reshaping the particles from their original shapes into spheres, the particles can lay closer together while the configuration of the particles remains the same. Tool 2 Configuration: Each connection in the city has connection intensities (people/min). Based on those intensities, each connection is ranked in a hierarchy: the higher the intensity, the more important the connection, the closer the particles are placed together. Since connection intensities change, the configuration of the particles change as well. Tool 3 Resizing particles: When particles reduce in size the pathways become shorter. Particles can resize to a minimum volume when they are not used. The minimum size of the sphere is the total volume of material, such as construction and furniture. Tool 4 Pathway volume: With enough lanes for the necessary pathway intensity we avoid congestion. Since connection intensities change continuously, the number of lanes and thus the pathway volume also changes. When the connection intensity is zero, the pathway volume is zero. Tool 5 Pathway merging: Merged pathways will take less space, reducing the size of the city and thus reducing travel time. Each connection will find its shortest route inbetween the particles.
When all tools are applied, Rotterdam citizens and visitors are estimated to spend 6 hours and 6 minutes per week on travel when all travel is done by bike. That is a travel time reduction of 51%.
Phase 4. Lose abstraction
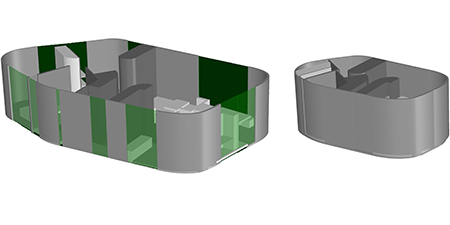
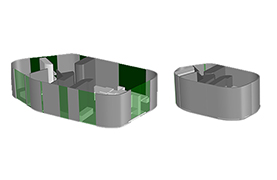
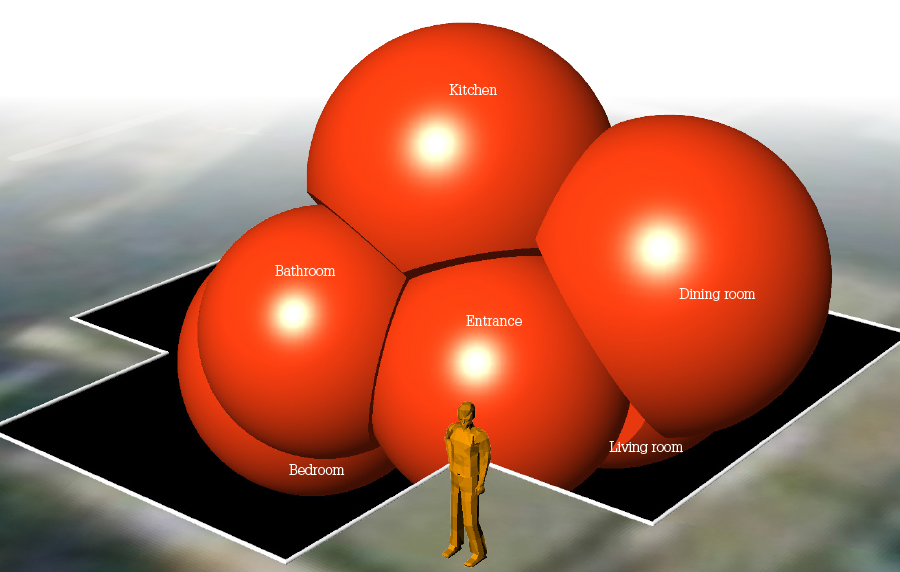
Some functions cannot be accommodated in a spherical shape: they need a certain surface and height. Therefore, in the case of the 2D configurations, most function volumes go back to their original surface and height.
As examples, three cities with different properties:
Fixed 2D configuration without resizing functions: The configuration is fixed and volumes do not resize. This means the volumes can be packed together, closing the gaps between them by turning into voronoi shapes. By closing the gaps, the city becomes smaller and therefore faster. Continuous 2D configuration with resizing functions: The configuration of the city continuously changes and functions grow and shrink in size. The functions should therefore have a floorplan with a shape that enables the particles to move beside each other: the most optimum is the circle. Fixed 3D configuration without resizing functions: The configuration is fixed and volumes do not resize. This means the volumes can be packed together, closing the gaps between them by turning into voronoi shapes.
As mentioned before, the project's format and developed tools are generic and could be applied to any case study on any scale: neighbourhood, home, Amsterdam, Randstad, airport, room, office, supermarket, school, university campus, railway station. City Accelerator already tested the tools and format on a neighbourhood and home.
The developed tools have succeeded in reducing travel time. Still questions remain such as: how can we make a moving and resizing city feasible? What would it look like? How do we provide the city with enough light? How do we use the city? Where do we know where we are and where to go to?
The project included some solutions to create moving and resizing buildings: such as a resizable home by sliding and folding walls and furniture and movable buildings by the use of a maglev system. However, to adequately answer these questions with designs, we need separate studies. The
perspective view and section.